Data Analysis & Identification Process
Process of Identification
The following methodologies can be followed for 16S rRNA/ITS/18S/custom markers as a tool to identify the bacterial/fungal/any organisms, respectively:
1. Source of Sample:
Environmental samples, Soil, Water, Clinical, or any place where microbes can exist.
2. Collection/ isolation of pure culture:
Thes samples can be collected in various forms but must be screened further and the pure cultures should be isolated using different isolation methods in petri plates/ slants/ suspension etc. One must remember that in case of Sanger’s Sequencing, the samples must be a pure culture without any contamination.
3. Selection of PCR Primers and amplification:
This is a crucial step that plays an important role in the identification process. Selection of the correct marker depends on type of organisms that need to be identified. According to the International Barcode of Life (iBOL), certain DNA regions (markers) have unique patterns and can be used as DNA barcodes for organism identification. There are specific markers designated as universal barcodes for bacteria and fungi, such as 16S rRNA and ITS, respectively.
In contrast, ITS sequences typically range from 500 to 800 bp in length and can be sequenced using two universal primers, such as ITS1 or ITS5 as forward primers and ITS4 as the reverse primer. Additionally, customized primers can be used to sequence specific regions of interest.
4. Sanger Sequencing:
The Sanger sequencing PCR can be set using Big-Dye terminator kit provided by Applied Biosystem/ Thermo. Following Sequencing PCR, the samples can be run on any of the variants of sanger sequencer available by AB such as ABI 3500XL Genetic Analyzer/ SeqStudio Genetic Analyzers and the raw data can be exported in the form of .ab1 (Applied Biosystem sequence data file) file and .fasta file format.
5. Data quality check (QC) check and generating FASTA files:
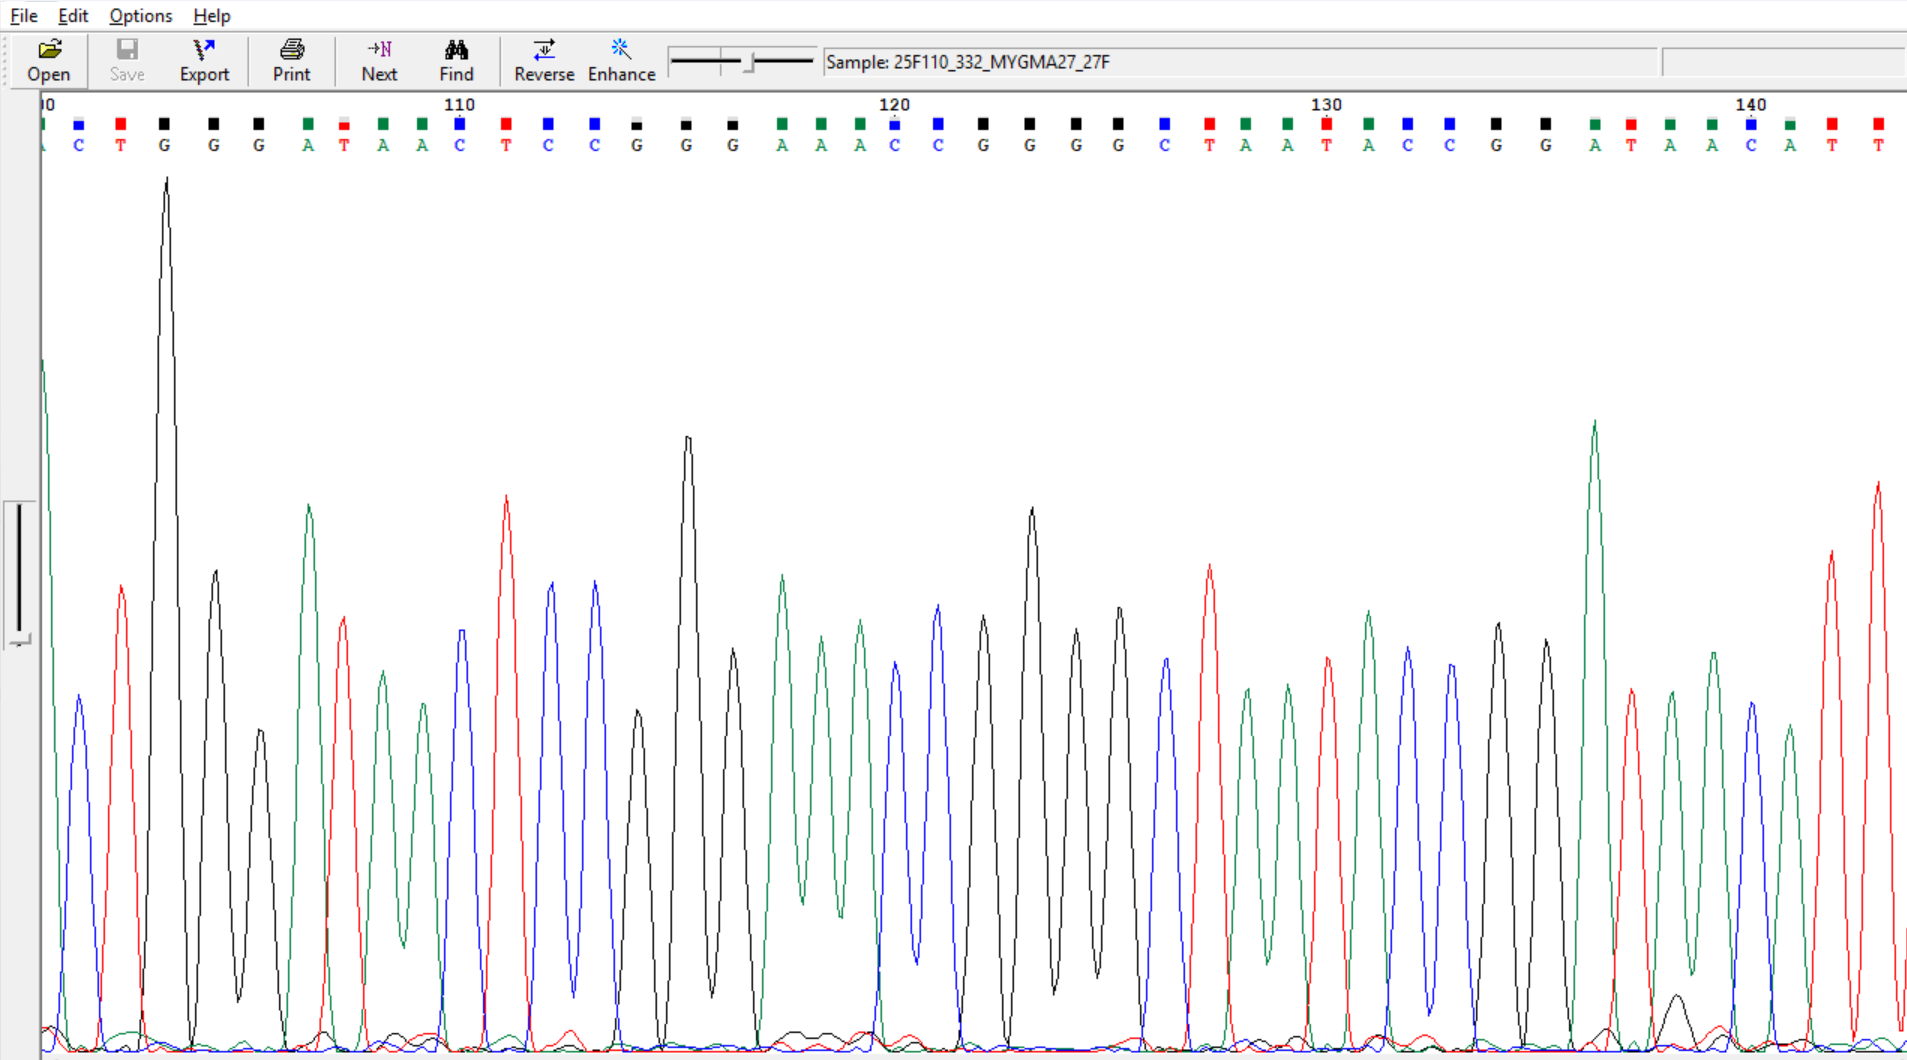
The quality of data can be tested using various available software/ application. The software can be accessed freely / paid subscription based. During QC of Sanger Sequencing data, the following steps can be followed.
Before we move forward, one must know what FASTA is:
FASTA format: The fasta is a unique format that can be utilized by various bioinformatics tools to read/ understand the genetic codes. In this case the format is represented in two lines (Fig. 4):
- Line 1 – it always starts with
>sign followed by unique identifier/ organism name followed by marker/ gene name and any other required details. - Line 2 – it always starts with the actual sequences such as A/T/G/C, the
sequences may appear in multiple lines based on the sequence length, but the new sequence can be added
only after next
>sign.

Questions/ Memory Test — Part 1
Test your understanding of FASTA formats, primers, and sample requirements.
Take Quiz — Part 1 →To analyze the data provided for practice, one can follow the steps below:
Steps to be followed:
Software/ applications to be used: Tracy (by Applied Biosystem)/ Chromas/ BioEdit/ FinchTV, etc. (Try any of the above or any alternate software and install them in your system Windows/ MAC/ Linux based on the compatibility of application).
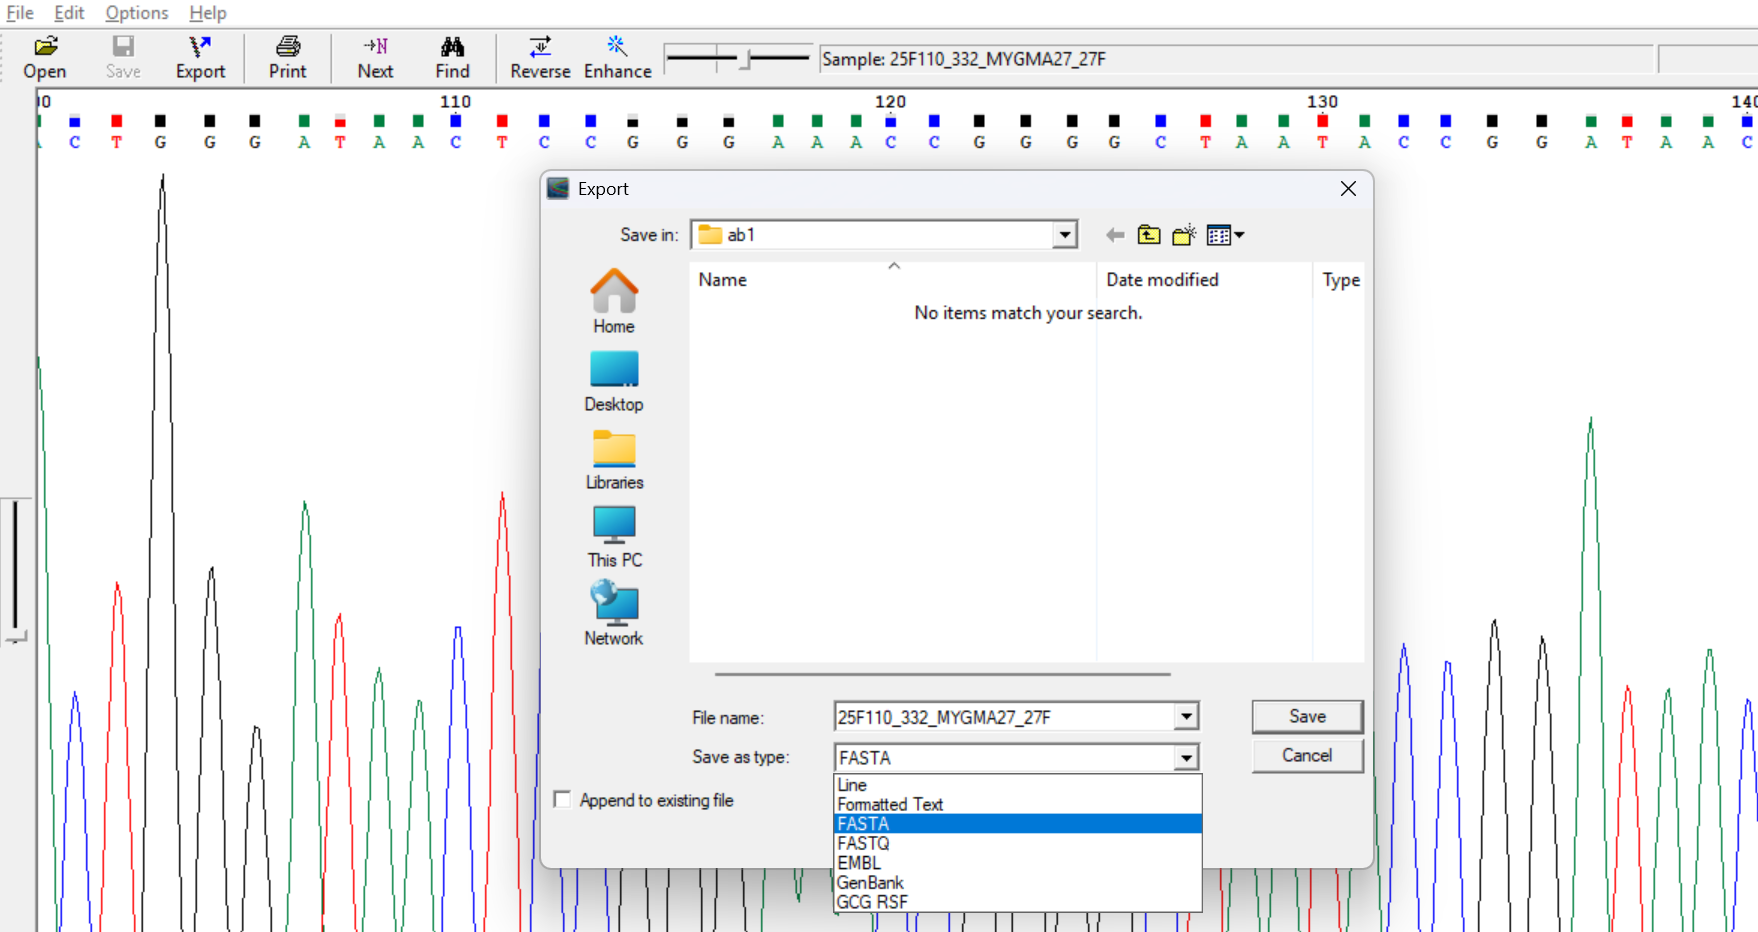
Ctrl+=)) before
exporting them in fasta or text format.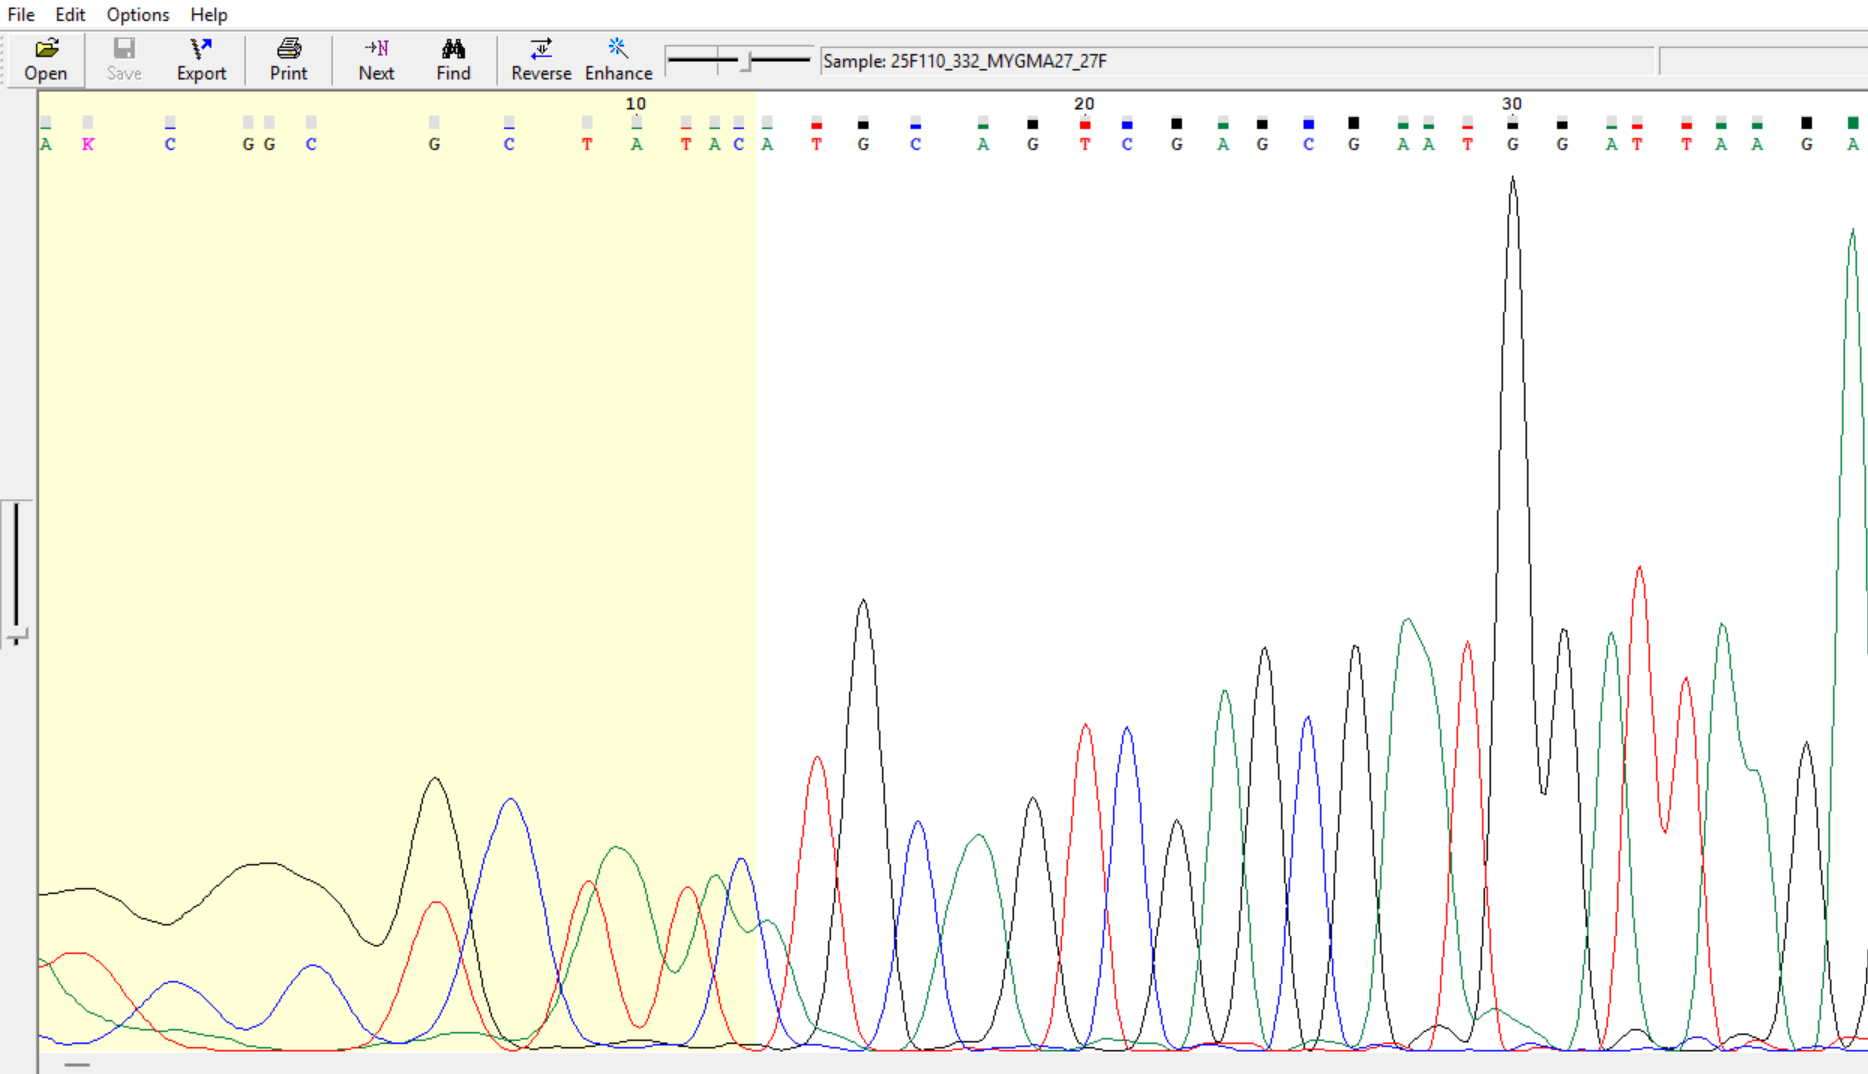
6. Assembly/ consensus contig sequence:
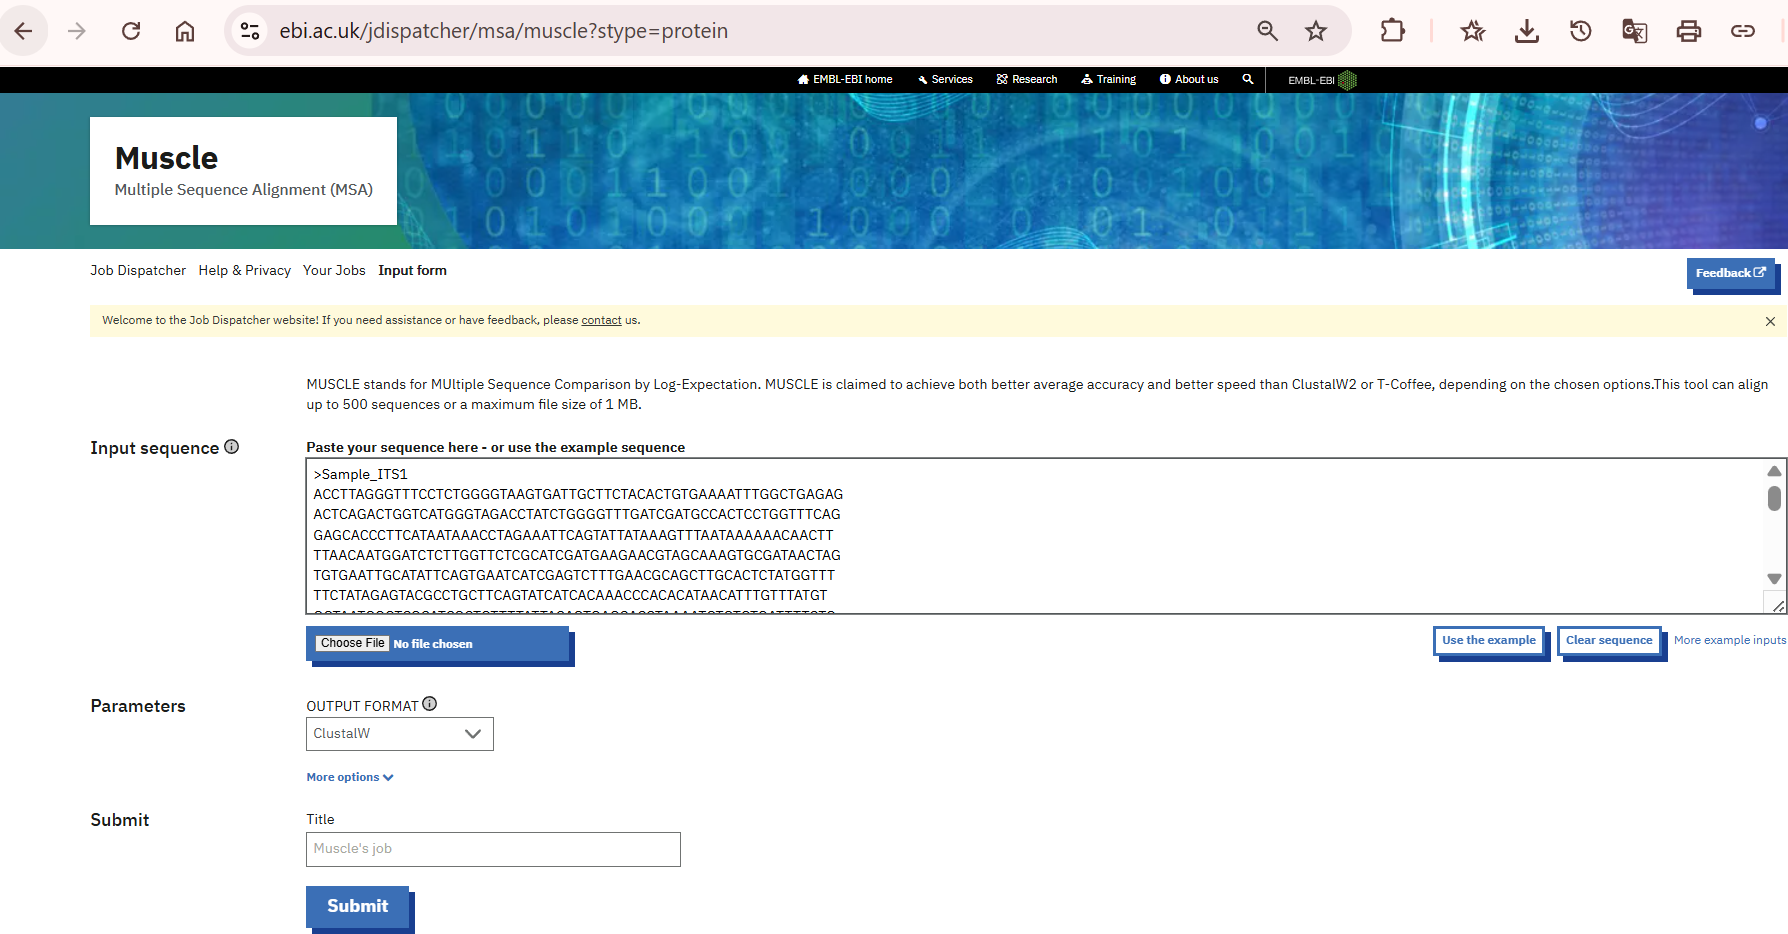
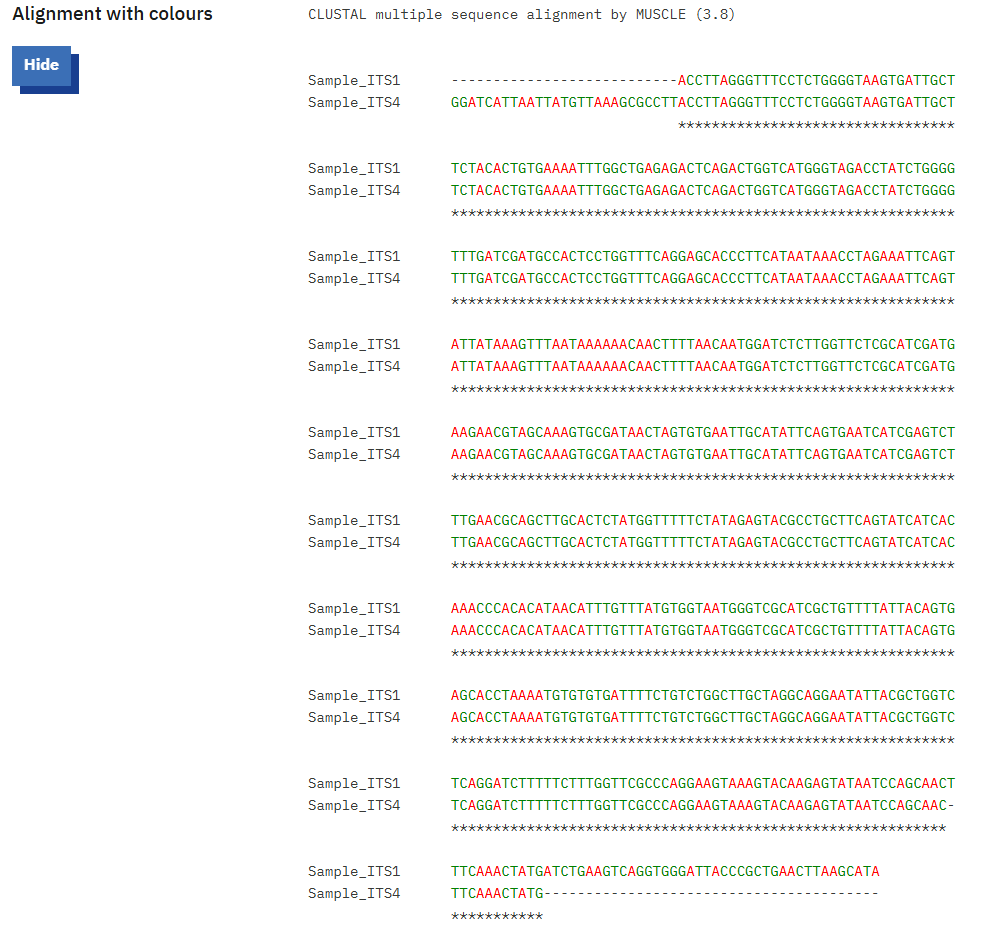
To generate the consensus sequences/ contigs, you may use any Multiple Sequence alignment tools offered by various databases or software such as ClustalW, EMBL, MEGA, BioEdit, etc. In this process we have used EMBL webpage to align and generate the consensus sequences (Fig. 8 and 9). For practice we used ITS (ITS1 and ITS4) (the following steps will remain same for all primers).
a. During the alignment process one should make sure that both the primers do have overlapping regions, otherwise there will not be a proper alignment.
b. The aligned files can be cross verified with the chromatograms and the final consensus sequences can be generated either by copying extra flanking regions from forward primer to reverse or vice-versa.
5.1. Possible errors and troubleshooting:
In case the primers do not show overlapping regions, this could happen due to following possibilities:
- i. Missing overlapping primers
- ii. Presence of homopolymers
- iii. Poor quality sequences
- iv. Selection of gene/ marker with multicopy gene
- v. Low primer efficiency with target gene/ marker
If sequence quality is not good or some of the bases depict mixed peaks/ high background noise in chromatograms, the alignment might appear with some ambiguities. Also, there is possibility of some other IUPAC based alphabets than standard A/T/G/C. Placement of such alphabet indicates uncertain bases or possible in-dels present in the sequenced region and such sequences must be verified followed by re-sequencing of same region.
Questions/ Memory Test — Part 2
Test your understanding of chromatogram curation, troubleshooting, and alignment tools.
Take Quiz — Part 2 →